 
Genomics Data Visualization Software
Comparison of Lactococcus lactis with Bacillus subtilis, Escherichia coli, and Pseudomonas aeruginosa
|
|
Project Scheme
1. Save your sequence files in a FASTA format
2. Run PyMood BLAST between a query database and up to three target databases. Three target databases are required if you want to explore your data in the PyMood 3D Viewer
3. Set up your .rgb file using the PyMood Data File Setup window
4. Start exploring your .rgb file in the PyMood 2D and 3D Viewers from the PyMood Project from Data File window.
Example Project Description
Predicted protein sequences of Lactococcus lactis is our query database.
We are going to compare the Lactococcus lactis proteins with proteins from three other bacterial genomes: Bacillus subtilis, Escherichia coli, and Pseudomonas aeruginosa.
Position of Lactococcus lactis protein sequences in the 3D space will be determined by their relationship (sequence similarity/identity) with the protein sequences of the three other genomes.
Goals of this project are:
1. Identification of the Lactococcus lactis proteins with highly similar homologs in the other three species
2. Identification of Lactococcus lactis specific proteins
3. Identification of Lactococcus lactis genes, which are only present in one or two of the other species
Project Implementation
1. Obtain and save the query and target database files
Download from NCBI the four genome files in FASTA format with predicted protein sequences from:
ftp://ftp.ncbi.nih.gov/genomes/Bacteria/Bacillus_subtilis/NC_000964.faa
ftp://ftp.ncbi.nih.gov/genomes/Bacteria/Escherichia_coli_K12/NC_000913.faa
ftp://ftp.ncbi.nih.gov/genomes/Bacteria/Pseudomonas_aeruginosa/NC_002516.faa
ftp://ftp.ncbi.nih.gov/genomes/Bacteria/Lactococcus_lactis/NC_002662.faa
and save them in the folder aaa in the directory
PyMoodMainDir > projects
If you have problems with downloading, you can find these files in the folder/directory examples:
PyMoodMainDir > projects > examples
2. Rename the data files for ease of manipulation
Because names are easier to memorize than numbers, we recommend you save (or copy):
NC_000913.faa as E_coli.fasta
NC_000964.faa as B_subt.fasta
NC_002516.faa as P_aerug.fasta
NC_002662.faa as L_lactis.fasta
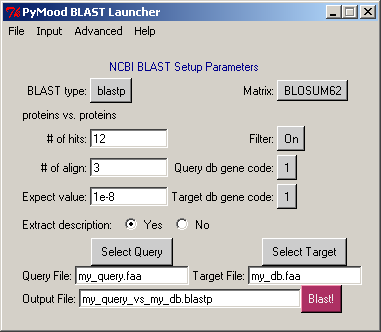
3. Use PyMood BLAST Launcher to generate PyMood import files
The next step of this project is to make a BLAST search of L_lactis.fasta against B_subt.fasta, E_coli.fasta and P_aerug.fasta. L_lactis.fasta is our query database file.
Start PyMood Blast Launcher
4. Select the query database
Click Select Query
Under the directory projects >aaa select file L_lactis.fasta
Extraction of FASTA headers should start automatically
As message Query file has been processed appears, click OK
5. Select the first target database
Click Select Target
Under the directory projects > aaa select file B_subt.fasta
Extraction of FASTA headers should start automatically
Message DB file has been processed will appear, click OK
Stay with the default options in the PyMood BLAST Launcher window
Click Blast!
Message You need to format the database... will appear
Click Format
The message box Database has been formatted will appear, click OK
Click Blast! again, BLAST should start
While BLAST is running you will see the message box BLAST currently running...
It takes about 6 min to finish BLAST on a 1 GHz processor
Wait until message BLAST Done has appeared
Click OK in the BLAST Done window
6. Select the second target database
Click Select Target again
Select file E_coli.fasta
Message DB file has been processed will appear, click OK
Click Blast!
Click Format
Click OK in the Formatting was done message box
Click Blast! again, BLAST should start (approximate run time is 6 min on a 1 GHz processor)
Click OK in BLAST Done message
7. Select the third target database
Click Select Target again
Select file P_aerug.fasta
Message DB file has been processed, will appear, click ,OK
Click Blast!
Click Format
Click OK in the Formatting was done message box
Click Blast! again, BLAST should start (approximate run time is 8 min on a 1 GHz processor)
Click OK in BLAST Done message
When the steps described above are completed, PyMood BLAST Launcher has all the necessary input files for PyMood generated.
8. Use PyMood to display database relationships
Click Exit in PyMood BLAST Launcher window
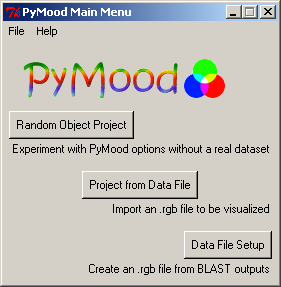
Start PyMood program
In the PyMood Main Menu click on Data File Setup
A Data File Setup window should appear:
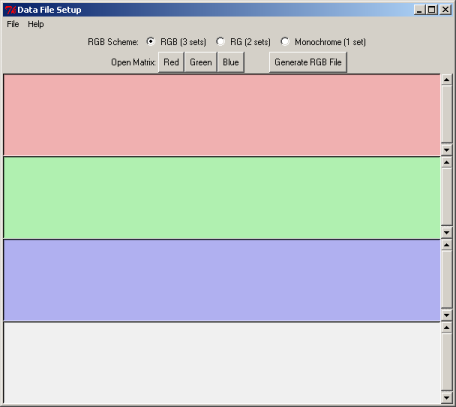
9. Associate the BLAST generated input files with specific colors and generate an RGB file
In the 3D viewer, we would like to display the relationship between Lactococcus lactis proteins and the proteins from the target genomes when:
Red axis displays similarity to Bacillus subtilis proteins
Green axis displays similarity to Escherichia coli proteins
Blue axis displays similarity to Pseudomonas aeruginosa proteins
In the Data File Setup window click Open Matrix "Red"
In the directory projects > aaa select file L_lactis_vs_B_subt.blastp.matrix, click Open
In the Data File Setup window click Open Matrix "Green"
Select L_lactis_vs_E_coli.blastp.matrix , click Open
In the Data File Setup window click Open Matrix "Blue"
Select L_lactis_vs_P_aerug.blastp.matrix , click Open
Click on the button Generate RGB File
The program will prompt to save it as...
Save the RGB file as L_lactis.rgb
As soon as the L_lactis.rgb file has been generated and saved, you can close the Data File Setup Project window
10. Visualizing the RGB file using the 2D and 3D PyMood viewers
The RGB file is used as input file for the 2D and 3D viewers. To launch 2D and 3D viewers click on Project From Data File in the PyMood Main Menu window.
A Project From Data File window should appear:
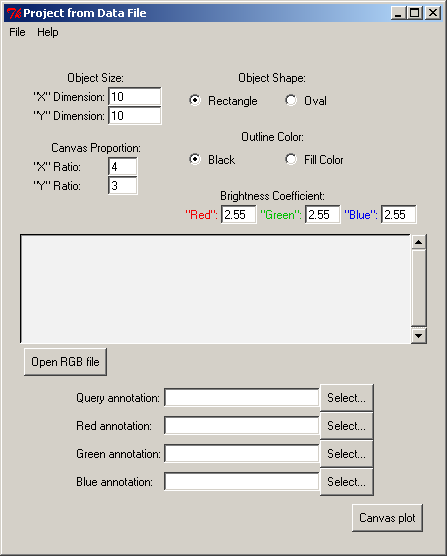
In the window Project From Data File click on Open RGB file button
Select L_lactis.rgb file , click Open
Click Select... button for Query Annotation , select L_lactis.fasta_header file, click Open
Click Select... button for Red Annotation , select B_subt.fasta_header file, click Open
Click Select... button for Green Annotation , select E_coli.fasta_header file, click Open
Click Select... button for Blue Annotation , select P_aerug.fasta_header file, click Open
Stay with the default settings in the Project from Data File window
Click Canvas plot button, and a colored canvas will appear
Click OK in the Canvas Plot Done window
Arrange the four windows:
PyMood Canvas
2D Object Info
Annotation Display 1
Annotation Display 2
in a way that you can see all of them simultaneously:
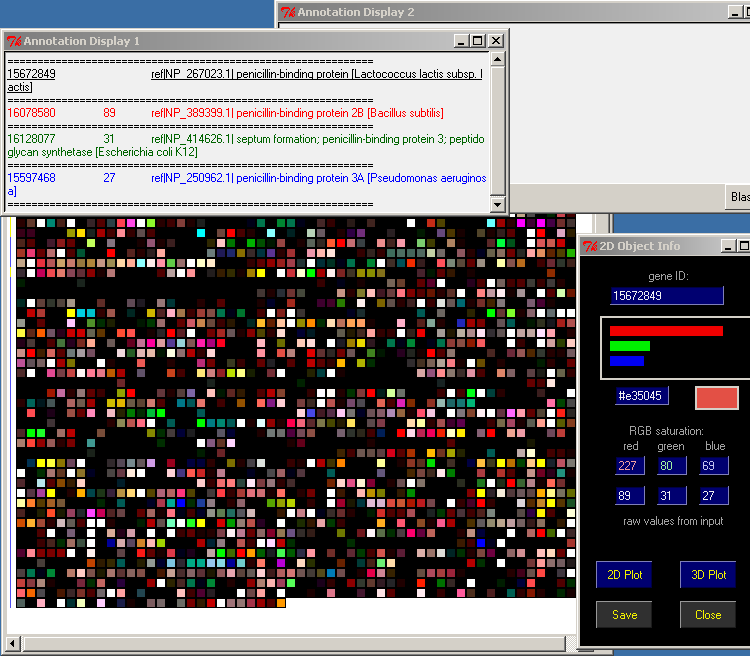
Minimize (do not close) all other windows on your screen
Point the mouse over any object on the PyMood Canvas and the Annotation Display 1 will display the FASTA header information
Double-click on a gene, and the FASTA header info will be displayed statically in the Annotation Display 2 window.
11. Start 2D Plot
Click 2D plot in the 2D Object Info window
A new Canvas 2D Plot will appear, and the Lactococcus lactis proteins will be sorted accordingly with their similarities to the sequences from the target databases.
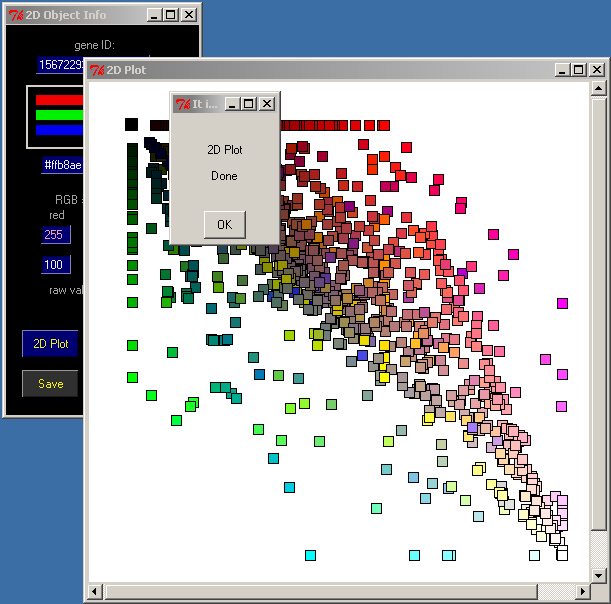
Click OK in the 2D Plot Done window
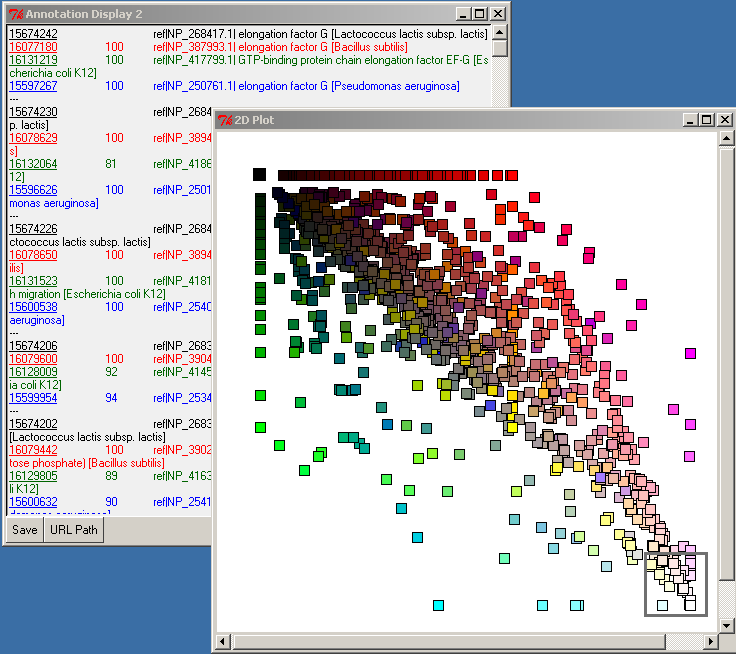
Use the press-and-drag right mouse button to select groups of genes.
Select a group of the lightest squares; those are the most conservative proteins within the analyzed group of bacteria.
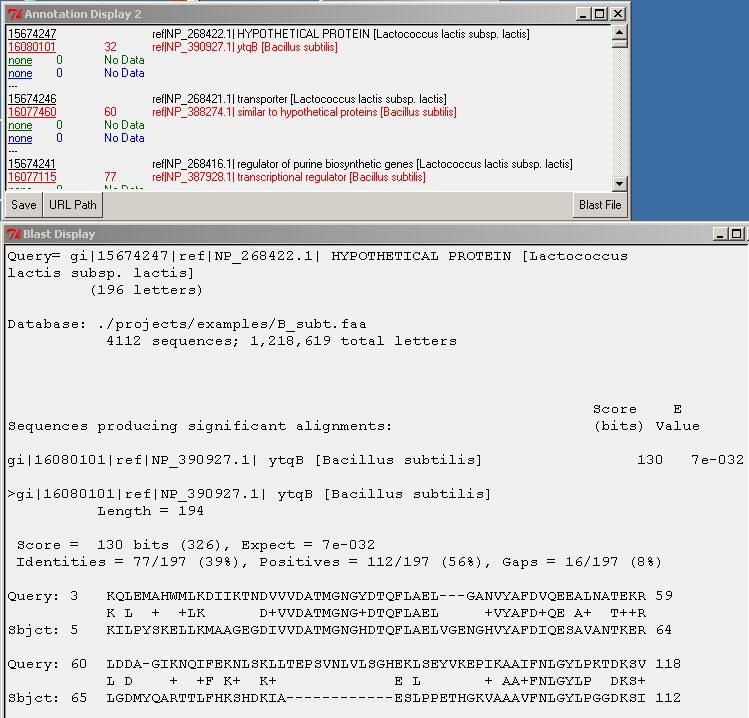
The list of selected genes will be displayed in the Annotation Display 2 window:
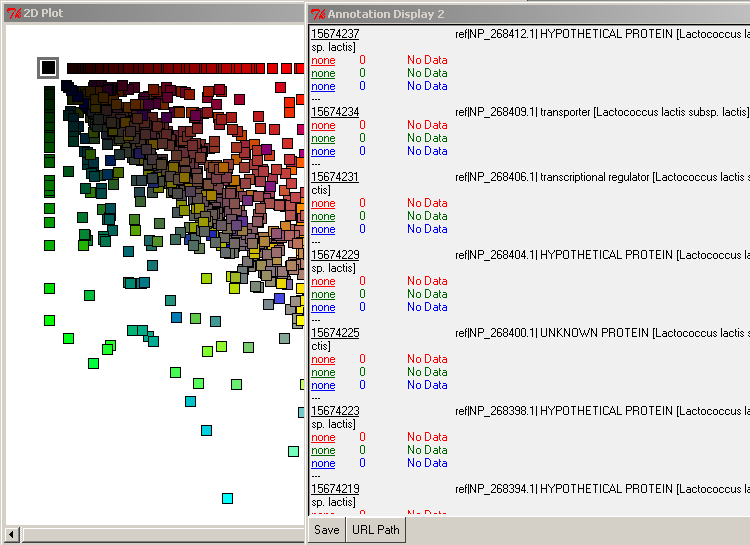
In the upper left corner, select the most-black square by pressing-and-dragging the right mouse button. This will select the genes which are specific (in the limit of our expectation cutoff in the PyMood BLAST Launcher, e-8) to Lactococcus lactis. Their annotation will be displayed in the Annotation Display 2 window:
By selecting the axially positioned genes, you may view only those shared by the query database and one target database. For example, if you select the red axis squares, you will retrieve the list of genes common between Lactoccocus lactis and Bacillus subtilis only.
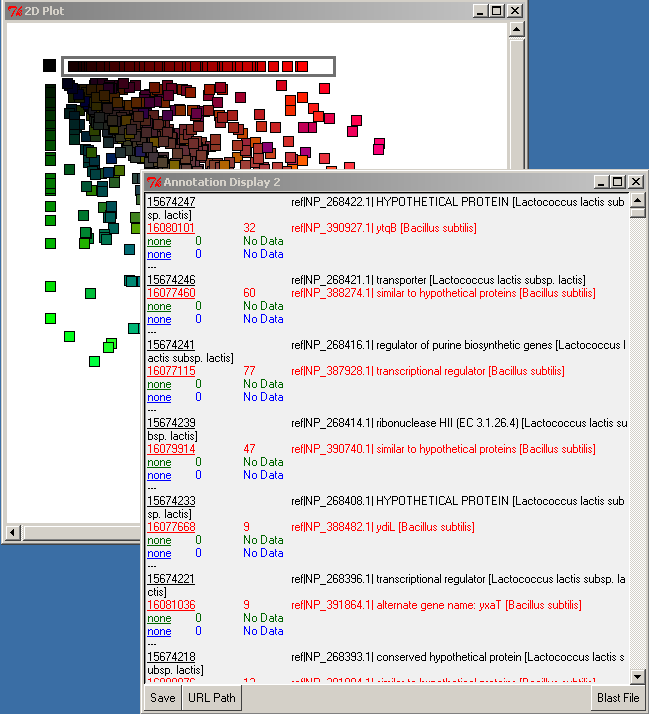
Left-double-clicking on an ID in the annotation window performs an external data lookup (see URL Path button), and right-double-clicking on the query ID (black font) performs a search for the alignment in the BLAST file. The Blast File button allows you to choose the BLAST file to use for the right-double-click action. To display the BLAST alignment for a selected gene, use right-double-click on the query ID (black font). The alignment will be displayed from the selected BLAST file.
The Save button on the 2D Object Info window will allow you to save the data you see in different ways.
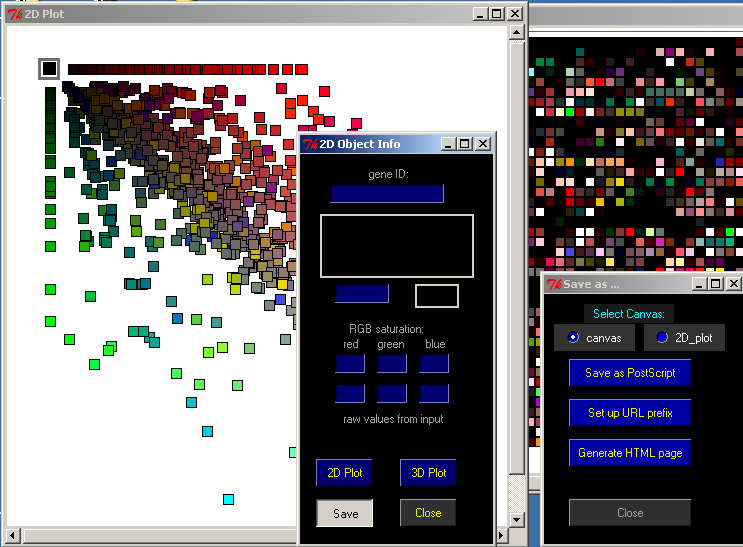
First, select which display you want to save, either the Canvas or the 2D Plot.
Save as PostScript will save either exhibit in PostScript format.
Set up URL prefix allows you to set the URL used for the webpage.
Generate HTML page will save a PNG image and HTML page for the canvas. The HTML page will contain imagemap tags that match the URL selected. You can open the saved .html file in any web browser.
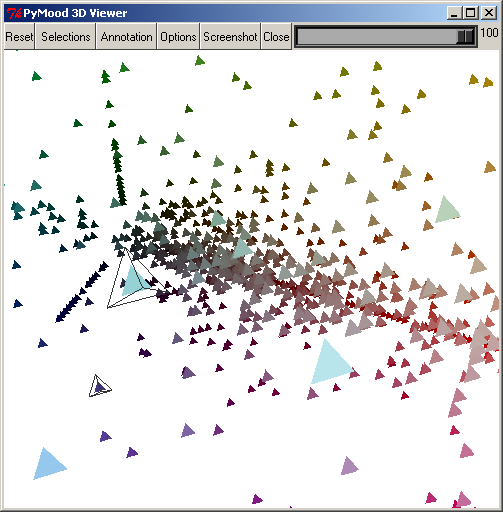
To explore this project in the 3D space click 3D Plot in the 2D Object Info window.
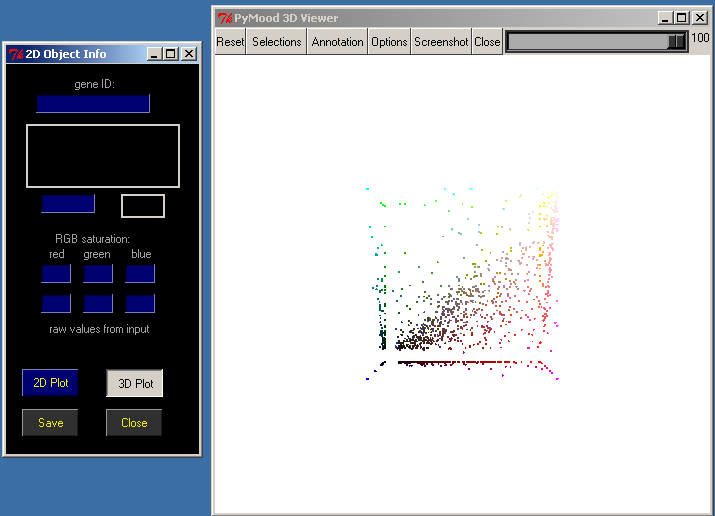
The PyMood 3D Viewer window has a toolbar at the top, and the main 3D canvas, which displays the objects.
To rotate the 3D canvas, click and drag with the left mouse button.
To zoom in and out, hold Shift down and click and drag with the right-most mouse button. Users with 3-button mice can use the middle-button alone to do the same.
To move the entire view of the objects, click and drag with the right-most mouse button.
To select an individual object, double click left mouse button on it or shift-click left button.
To unselect an individual object, double click left mouse button on it or shift-click left button.
The following buttons can be found on the toolbar :
The Reset button resets the rotation, zoom, and center point.
The Selection button will display a window that will allow you to select objects. This will be covered later.
The Annotation button will display the annotation for the objects that are currently selected.
The Options button presents a list of options to manipulate the display of the objects.
The Screenshot button allows you to save the 3D canvas to a .png image. It will prompt you for a file name.
The Close button will close the 3D viewer.
The Scrollbar on the top-right allows you to change the background on the 3D canvas to colors between black and white.
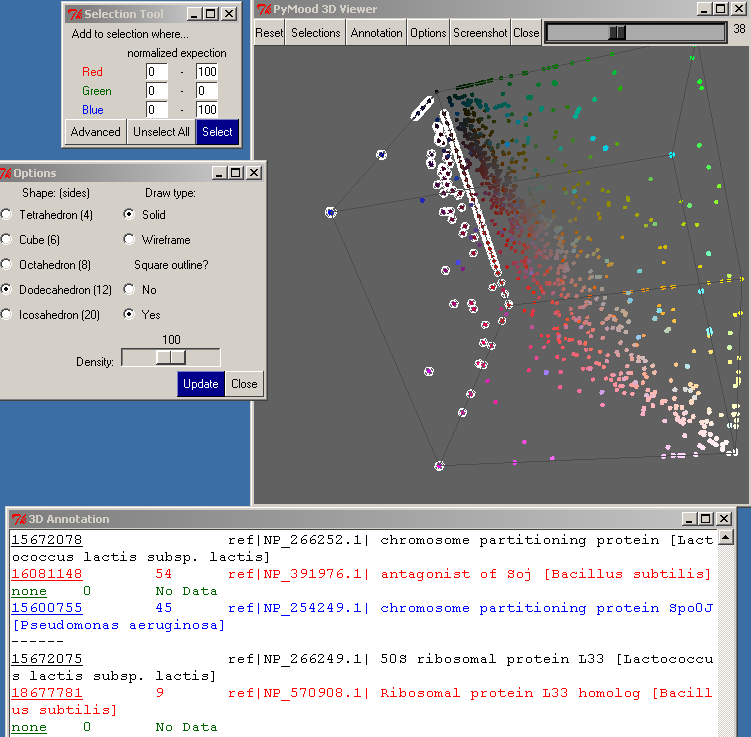
The Selection button opens the Selection Tool.
There are 6 entry boxes in this window, 2 for each color. For each color, you need to type in a range between 0 and 100 for selection. For example, if you want to select the objects closest to the white area, you would use:
Red 90 - 100
Green 90 - 100
Blue 90 - 100
If you wanted to select the plane with Blue and Red objects, you would use these values:
Red 0 - 100
Green 0 - 0
Blue 0 - 100
To carry out the selection, press the Select button.
After you have made a selection, you may type in other numbers here and press the Select button again, which will add to the selection.
To unselect all the objects, press the Unselect All button.
Clicking on the Advanced button in the Selection Tool will bring up the Advanced Selection dialog. This dialog allows you to select data points represented equally in two target databases, but not at all in the third target database. You may also select data points represented equally in all three target databases.
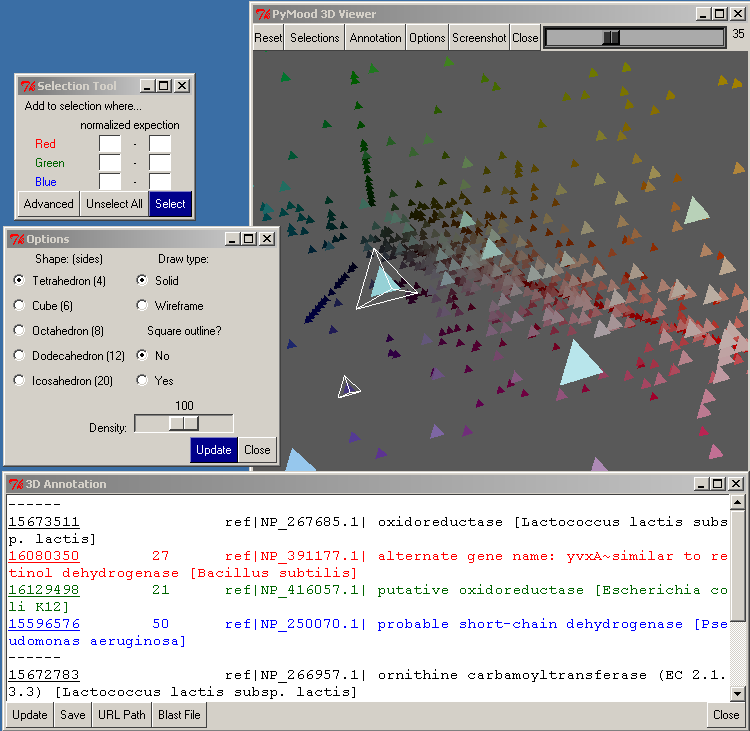
The Annotation button brings up the 3D Annotation window.
If there were objects selected when you clicked on this button, their annotations will be shown in the 3D Annotation window.
Left-double-clicking on an ID in the annotation window performs an external data lookup (see URL Path button), and right-double-clicking on the query ID (black font) performs a search for the alignment in the BLAST file. The Blast File button allows you to choose the BLAST file to use for the right-double-click action. To display the BLAST alignment for a selected gene, use right-double-click on the query ID (black font). The alignment will be displayed from the selected BLAST file.
The URL Path button opens the URL Path Setup window. The URL Path Setup window allows you to chose a URL from the list, add a URL, delete a URL, and change your network settings for the left-double-click action.
The first button in the Annotation window is Update , which updates the annotation window to reflect the selected objects.
The Save button will present a prompt for a file name in order to save the text in the annotation window as a text file.
The Close button closes the Annotation Window.
The Options button on the top toolbar of the PyMood 3D viewer opens the Options window.
One of the parameters that may be modified is the Shape of the objects on the 3D canvas. The default is Tetrahedron, which is the fastest because it only has 4 sides. Selecting a more detailed shape may be useful if you have fewer objects or want to take a screenshot.
The Draw Type allows you to set the Shape as solid or wire-framed.
If Square Outline is set to Yes, a wire-frame cube will be drawn around the entire 3D cube.
Density allows you to change how closely the objects are oriented in the 3D canvas.
You must click the Update button for the changes to take effect.
|
|

