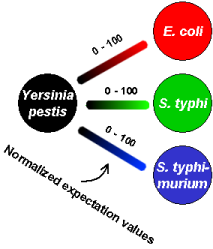
Yersinia pestis vs. Escherichia coli
Yersinia_pestis_KIM_vs_Escherichia_coli_K12.blastp
Yersinia pestis vs. Salmonella typhi
Yersinia_pestis_KIM_vs_Salmonella_typhi.blastp
Yersinia pestis vs. Salmonella typhimurium
Yersinia_pestis_KIM_vs_Salmonella_typhimurium.blastp
(Sorry for the inconvenience, blastp files will be available for download soon.)
RGB Matrix File (all matrix files combined): Yersinia_pestis.rgb
.rgb file format
The .rgb file consists of seven columns:
A. unique identifier for query gene
B. normalized expectation value of the best hit from the red target database
C. normalized expectation value of the best hit from the green target database
D. normalized expectation value of the best hit from the blue target database
E. unique identifier of the best hit from the red target database
F. unique identifier of the best hit from the green target database
G. unique identifier of the best hit from the blue target database
* normalized expectation value reflects the absolute value of the exponent in the expectation value. If the expectation value is 2x10-15 (2e-15), the normalized expectation value is 15. For all expectation values better than 10-100 (1e-100), like 3x10-101 (3e-101), 7x10-156 (7e-156), etc., the normalized expectation value 100 is assigned.
The .rgb file can be visualized in PyMood.
|
|