
|

| home | contact | press | arabidopsis | yersinia | fowlpox | mpss | cacao |
browsable images Yersinia pestis proteins are represented by squares. The position of every protein reflects the position of the corresponding gene on the Yersinia chromosome/NCBI FastA file. The protein squares are clickable and linked to the corresponding files in GenBank. The color of the square reflects the degree of the protein sequence similarity to the best hit in E. coli (portion of the red component in the final color), S. typhi (portion of the green component in the final color), and S. typhimurium (portion of the blue component in the final color). The white squares represent Yersinia pestis proteins with highly conservative homologs in the other three species. The black squares represent Yersinia pestis specific proteins without significant hits to the other three species (in the limits of the expection cutoff e-8). 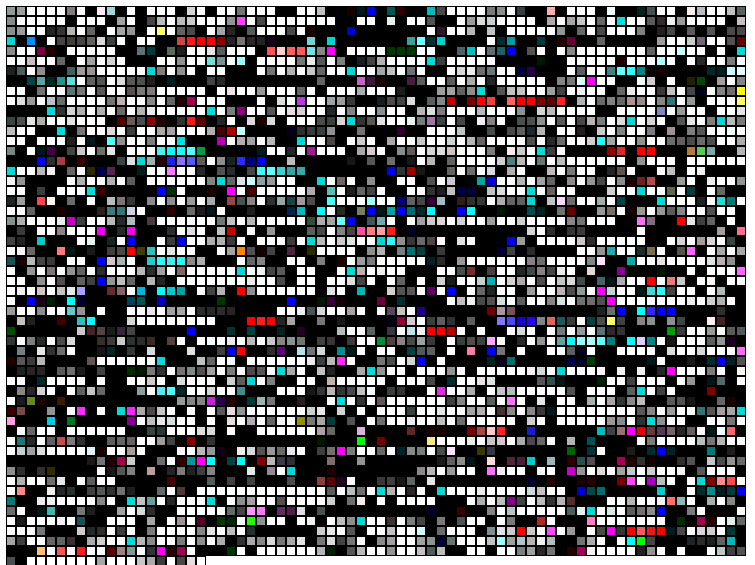
Yersinia pestis proteins are represented as squares. The position and the color of every protein the degree of the protein sequence similarity to the best hit in E. coli (portion of the red component in the final color), S. typhi (portion of the green component in the final color), and S. typhimurium (portion of the blue component in the final color). The visible elements are clickable and linked to the corresponding files in the GenBank. The white squares represent Yersinia pestis proteins with highly conservative homologs in the other three species. The black squares represent Yersinia pestis specific proteins without significant hits to the other three species (in the limits of the expection cutoff e-8). 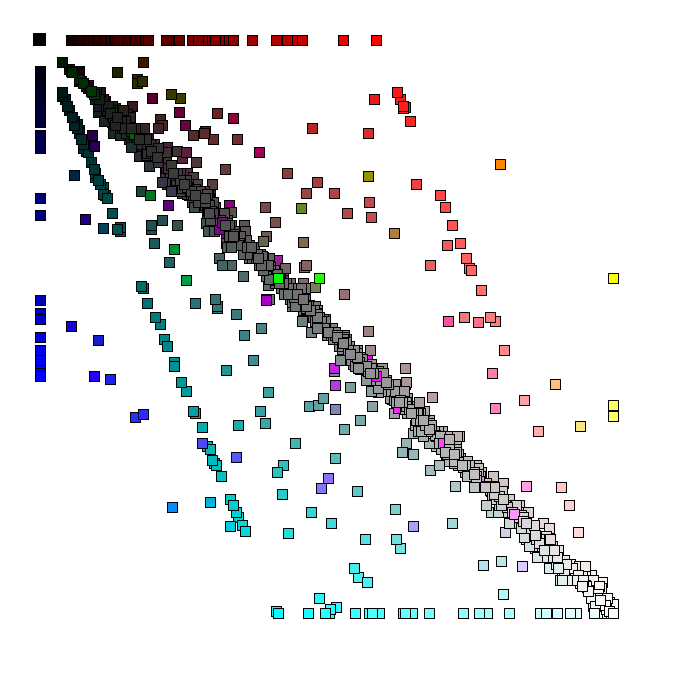
Yersinia pestis proteins are represented as circles. The position and the color of every protein the degree of the protein sequence similarity to the best hit in E. coli (portion of the red component in the final color), S. typhi (portion of the green component in the final color), and S. typhimurium (portion of the blue component in the final color). The visible elements are clickable and linked to the corresponding files in the GenBank. The white circles represent Yersinia pestis proteins with highly conservative homologs in the other three species. The black circles represent Yersinia pestis specific proteins without significant hits to the other three species (in the limits of the expection cutoff e-8). 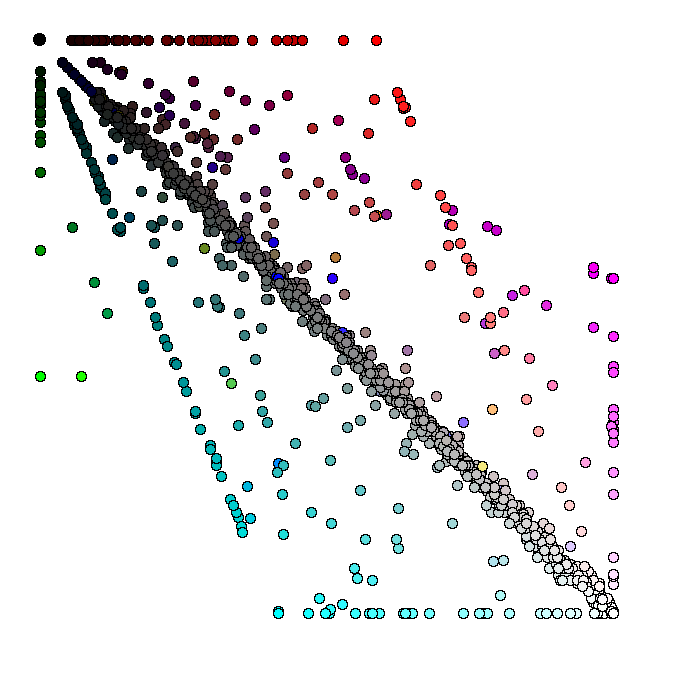 Continue to gene lists
 |
|
|